


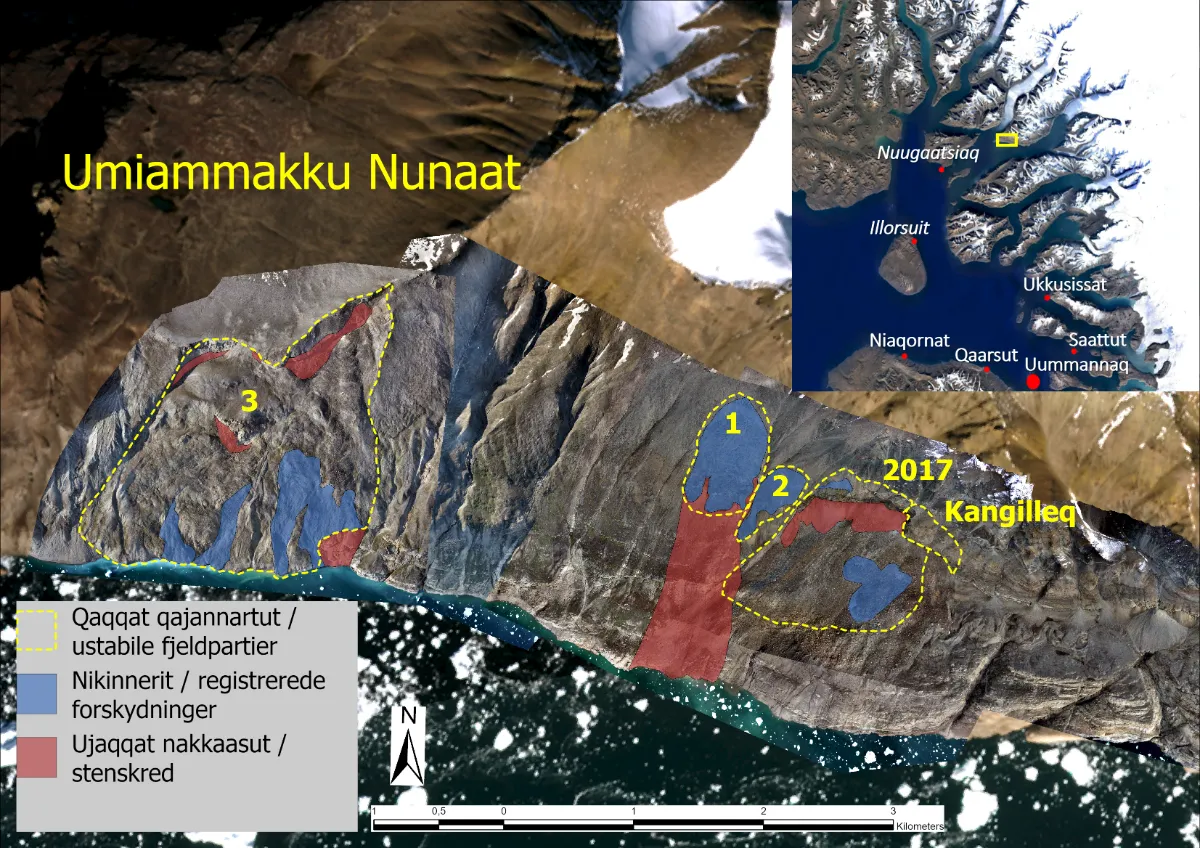
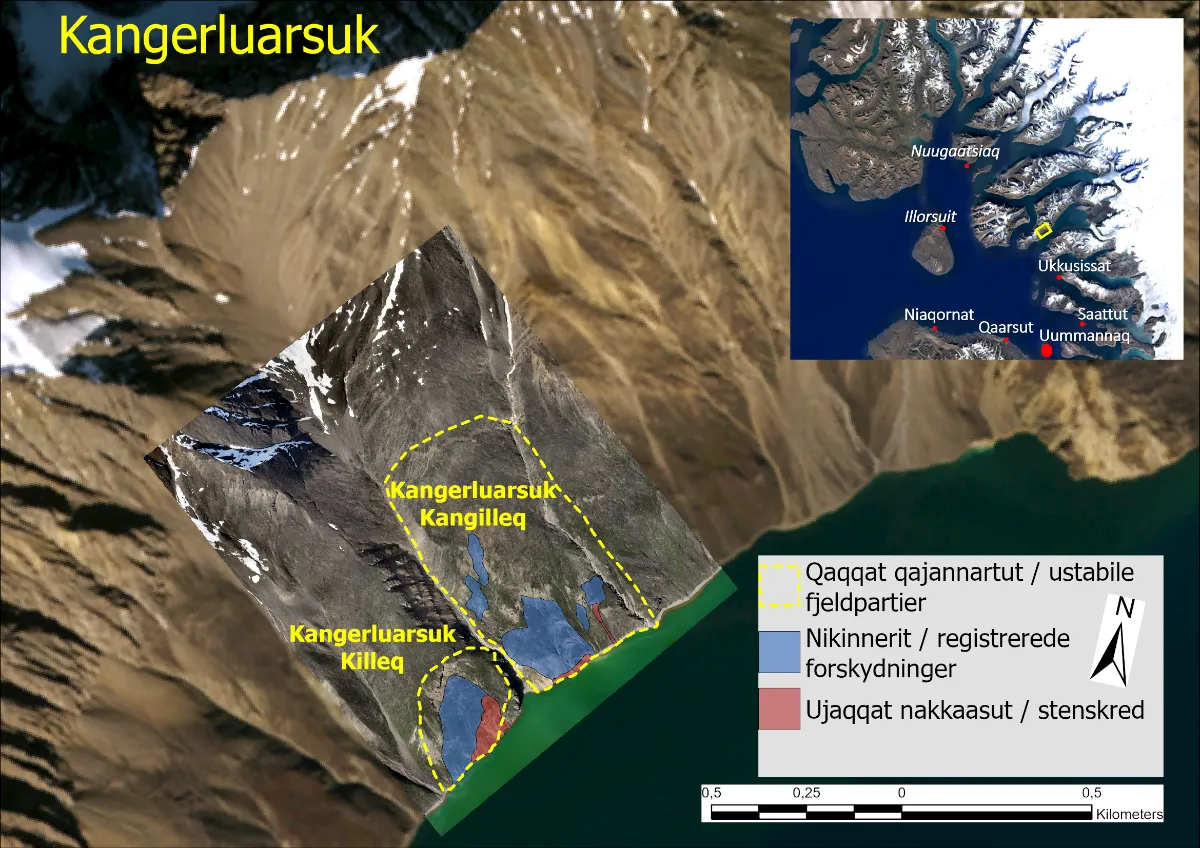
Current monitoring shows no immediate signs of a major rock avalanche or dangerous wave run-up in inhabited areas of the Uummannaq fjord system. However, spontaneous smaller-scale slides and rockfalls may occur in the unstable slopes marked in red in Figures 1 and 2. It is advised to avoid staying near these areas.
Summary of Monitoring Data Collected Over the Past Month
Rockfall activity and observed displacements in the monitored slopes are shown as colored areas in the maps in Figures 1 and 2. Blue areas on the map indicate areas with displacement activity, while red areas mark locations with repeated rockslides within the past month.
Monitoring data from February 2025 shows varying degrees of rockfall activity in both Umiammakku Nunaat and Kangerluarsuk. In the coastal section of the Kangerluarsuk Killeq slope, there is still increased rockslide activity. In this area, it cannot be ruled out that a portion of mass could slide into the fjord. This is inferred not to pose a threat to inhabited areas, but it may result in localized wave run-up in the Kangerluarsuk area.
The next monthly assessment will be published on Wednesday, April 2, 2025. However, if critical changes occur in the monitored slopes, a notice will be issued earlier.
Monitoring Techniques – GPS-Based Movement Measurements in Unstable Slopes
Monitoring of mountains with a known risk of tsunami-triggering rockslides in Umiammakku Nunaat and Kangerluarsuk is carried out using a number of methods. The collected data includes camera images, GNSS stations (GPS-based movement measurements—both offline and data-transmitting), seismic data, and drone images for high-resolution photogrammetry. The purpose of the monitoring system is to detect any unfavorable developments that could lead to a rock avalanche in time to intervene. The collected data is also valuable for understanding the processes taking place in these unstable mountain sections.
In Figure 3 below is a graph showing the progression of displacements over time in the unstable slope in Kangerluarsuk, based on measurements from GNSS (GPS) stations.
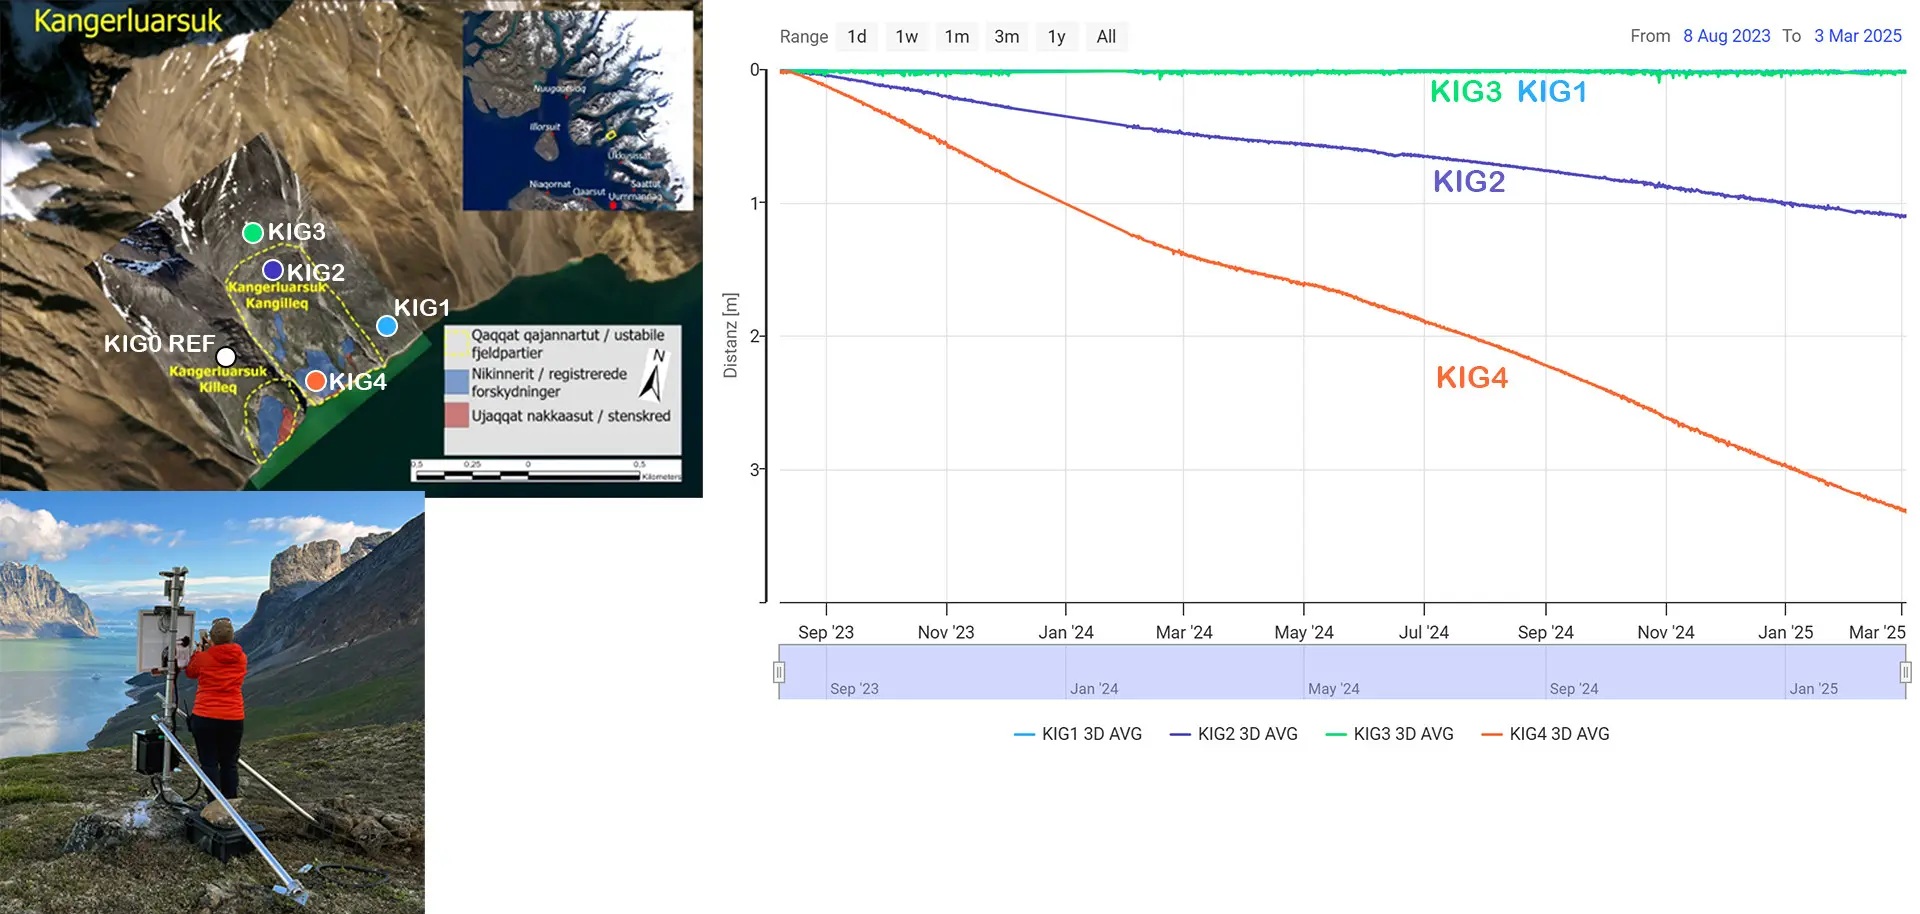
Displacements are recorded by four GPS stations installed on the slope. These stations transmit position data daily to landslide geologists. The available data was collected from early August 2023 to March 3, 2025. Two of the GPS stations are located on the unstable part of the mountainside (KIG4, shown by the orange curve, and KIG2, shown by the blue curve).
GPS station KIG2 is situated in the upper part of the unstable slope. Since its activation in August 2023, it has moved just over one meter.
KIG4, located in the lower part of the slope, has moved a little over 3.3 meters in the same period.
KIG1 and KIG3 are located outside the unstable slope area, and their data shows virtually no movement there.
The graph also indicates that displacements recorded from February 2023 to the end of May 2024 were slower than in the fall of 2023, followed by higher displacement rate during the summer and fall months. Over the past month, there has been a slight and gradual slowing of the displacement rates.